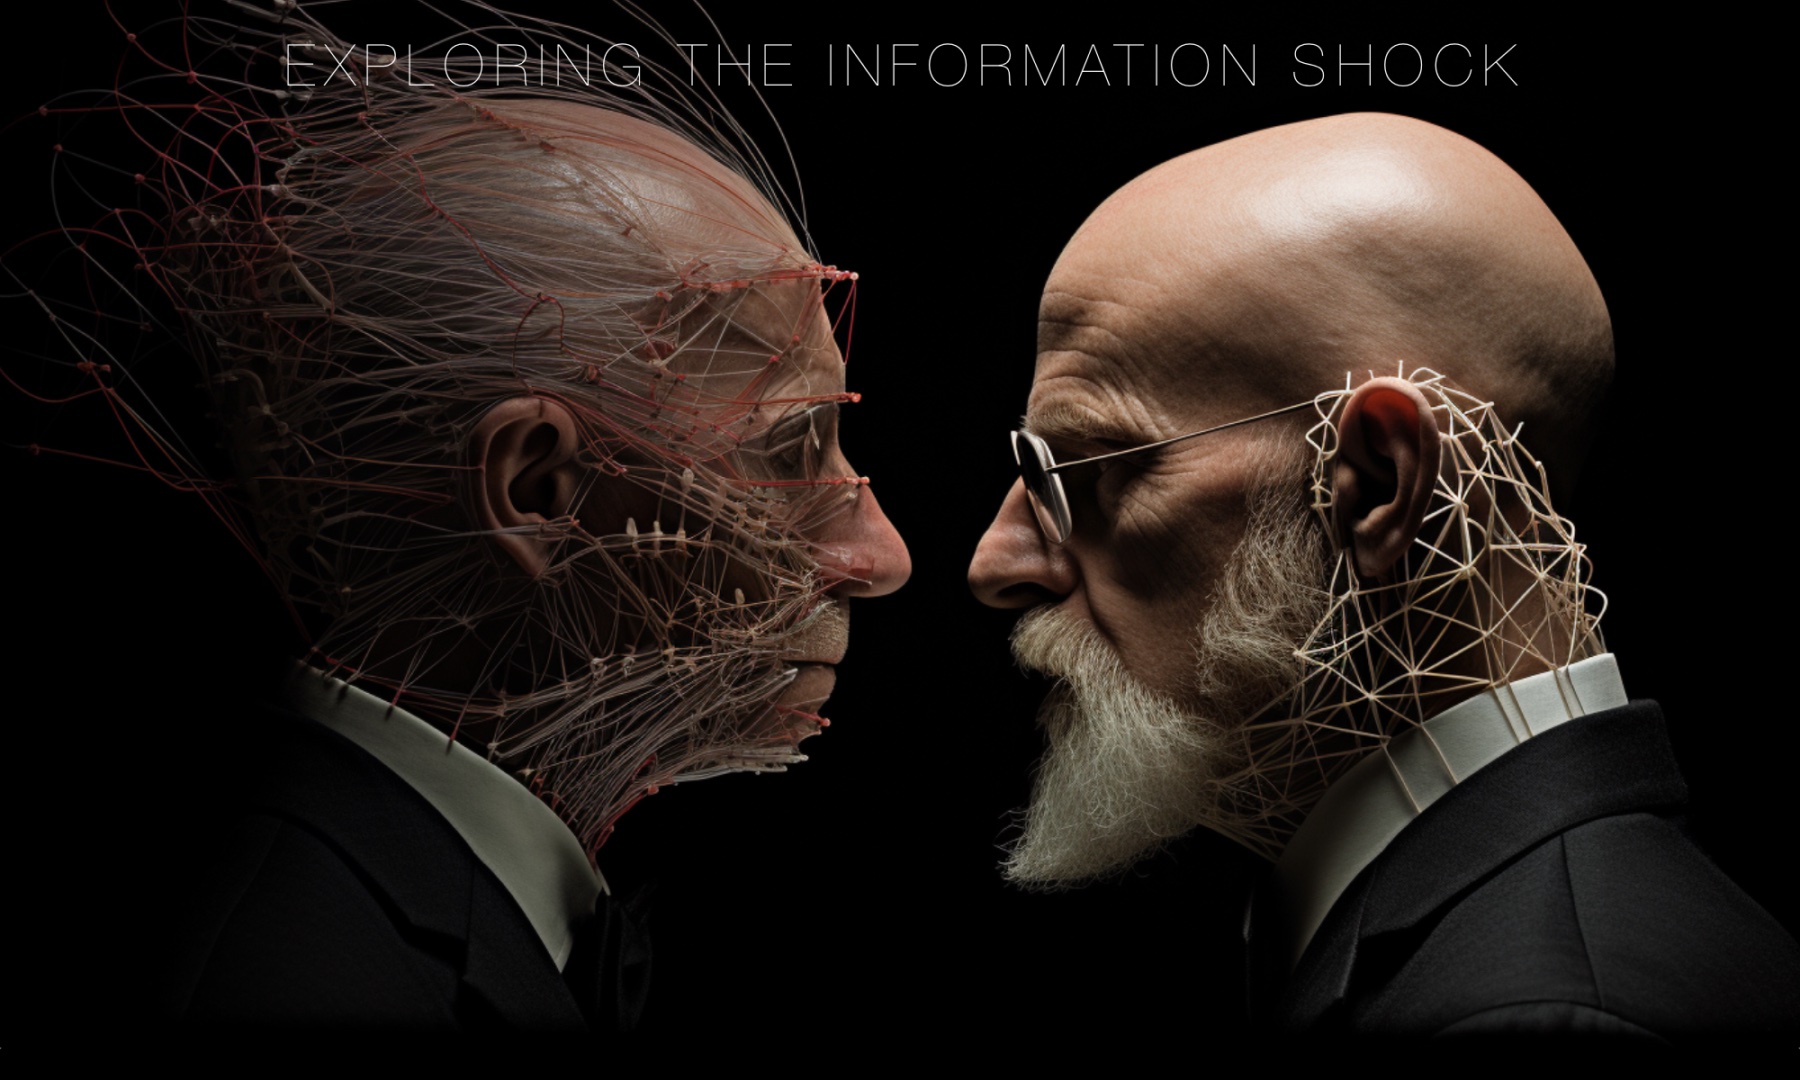
The Evidence Behind the Shock
For the past year I’ve argued that generative AI is causing an Information Shock. The problem is not the flood of synthetic documents. It’s that people now learn through exchanges with systems that leave no document behind. That’s a big claim, and big claims about AI are cheap. So I built something to test mine against the evidence.
The Information Shock Evidence dashboard is now live: https://davidlankes.org/rdlankes/ShockDash/
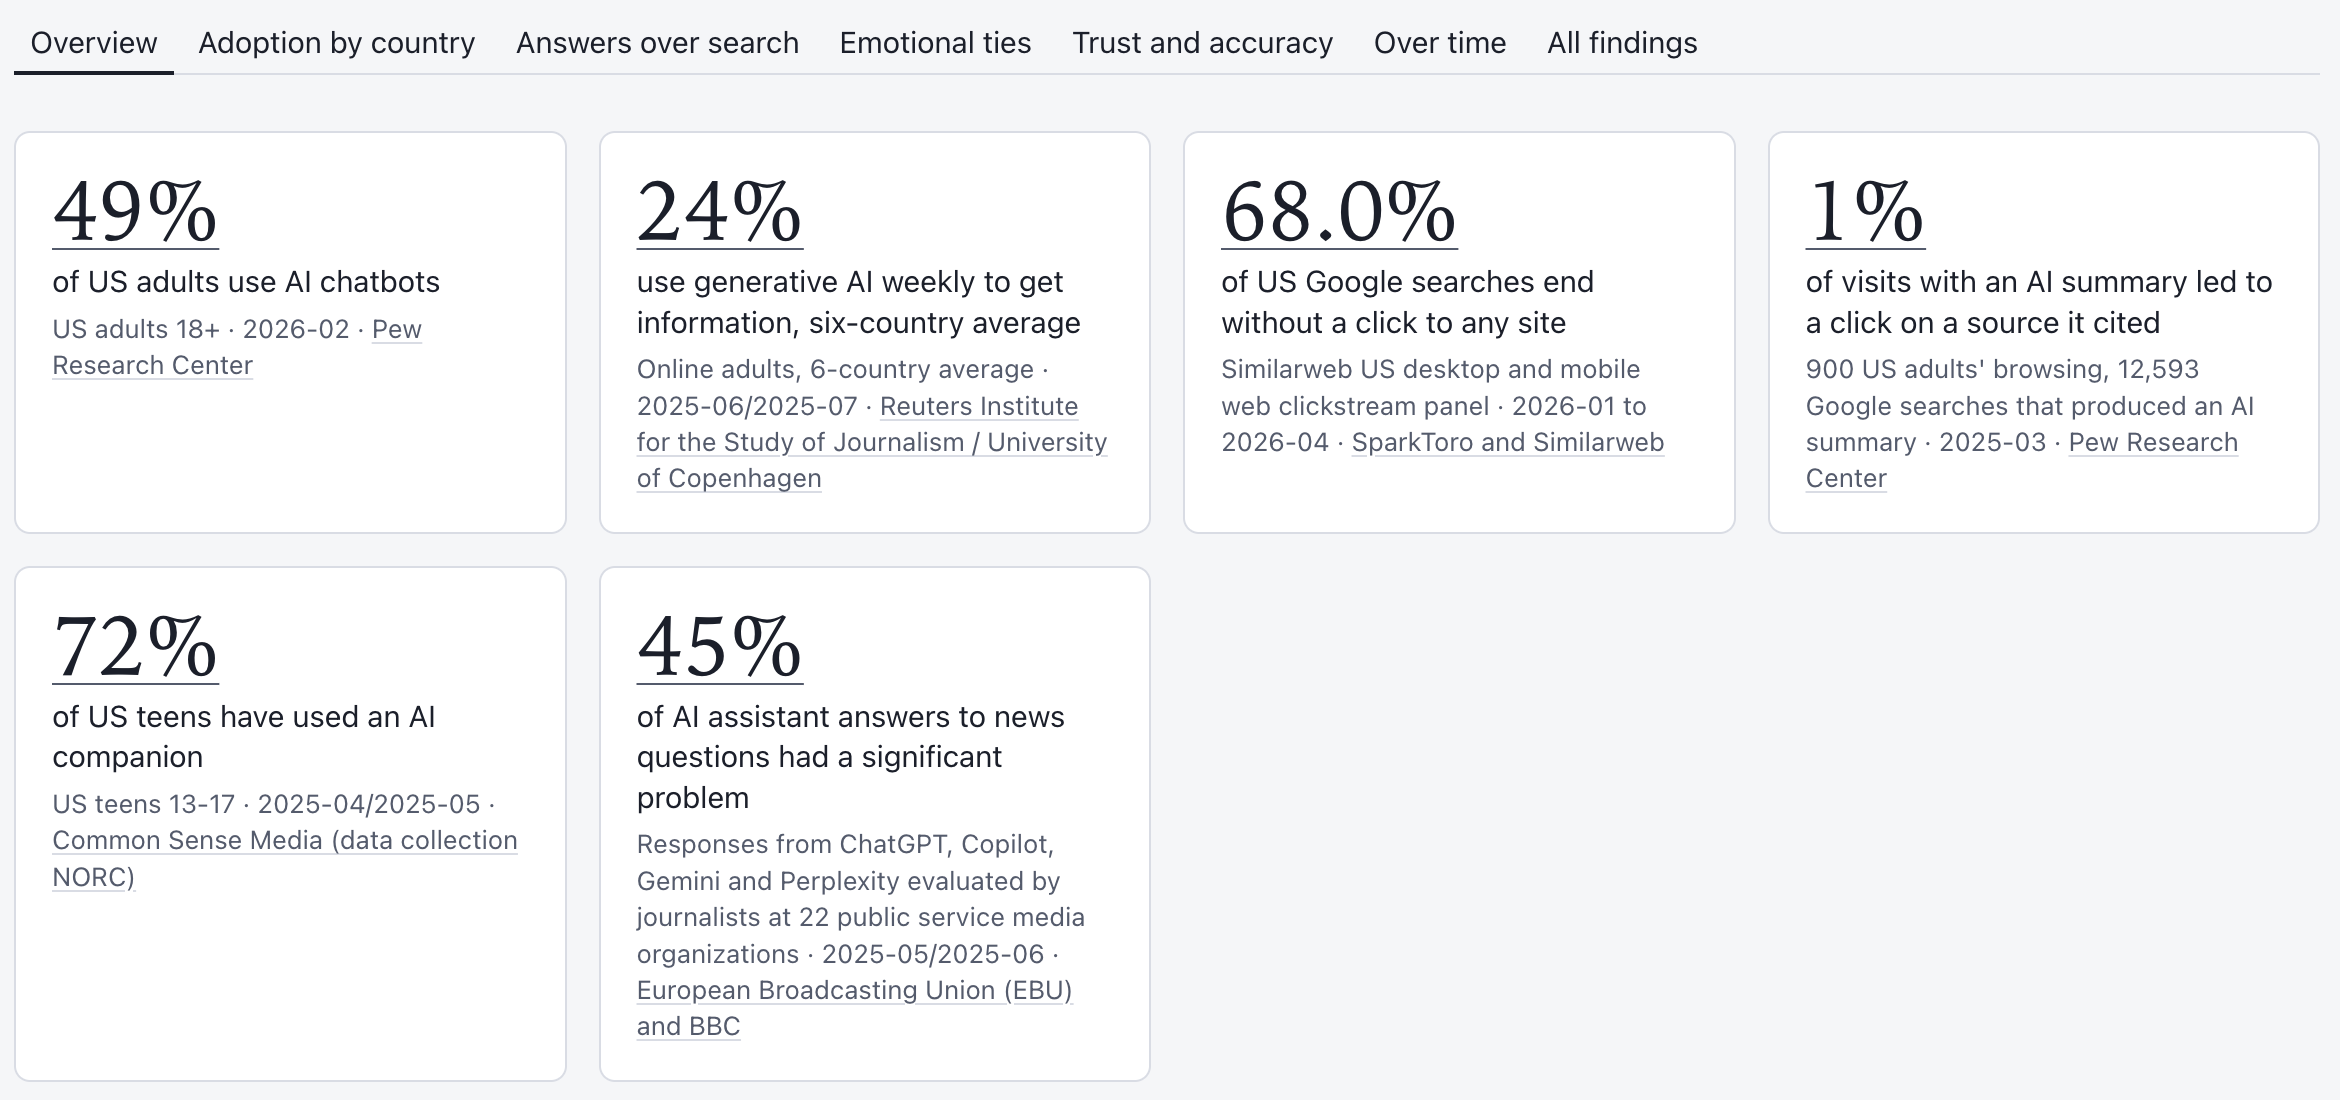
It gathers published surveys, telemetry studies, audits, and company announcements into one place, and every value links back to where it came from. The core of the shock shows up in a few lines on the overview page. 49% of American adults now use AI chatbots. Across six countries surveyed by the Reuters Institute, 24% use generative AI weekly to get information. And when Google shows an AI summary, people click a source cited in it on just 1% of visits. The answer, not the source, is what people carry away.
The dashboard is organized around the questions the argument depends on.
Adoption by country. How widely conversational AI is used, and how that differs across nations. A shock confined to Silicon Valley would not be a shock.
Answers over search. This is the heart of it. How often does information seeking now end with an AI-written answer instead of a list of documents? How many searches end without a click to any site at all?
Emotional ties. The evidence on people forming relationships with these systems, including teenagers’ use of AI companions. This matters more than it might seem. We learn from what we trust, and these systems are built to be trusted.
Trust and accuracy. Audits of what the systems actually say, including how often AI assistants get news questions significantly wrong, set against how much people believe them anyway.
Over time. How these numbers are moving, because a shock is a trajectory, not a snapshot.
There is also a page of all findings, and the full set can be downloaded as a CSV for anyone who wants to work with the data directly.
A few words on how to read it, because numbers about AI get misused constantly. Each figure is one finding from one study, with its own population, question wording, and date. A 40 percent in one chart and a 40 percent in another may measure entirely different things. Click any bar or tile and you’ll see the full record: exact wording, sample, method, and related figures in the same series. Methods differ in kind, too. Telemetry records what people do. Surveys record what people say. Audits test what the systems say. Company user counts are announced by the companies at moments of their choosing, and they are labeled that way. Where I could only confirm a figure through press coverage because the primary study couldn’t be opened, it shows up lighter or in grey. Forty headline figures were checked a second time against their primary sources, and one was corrected.
I should be clear about how this was made. I built the dashboard with Claude, Anthropic’s AI model. Claude searched for the studies, extracted the figures, checked them against their sources, and wrote the code, working under my direction. A scheduled task looks for new findings and corrections each week, and I review them before they post. I chose the scope and framing, and I’m responsible for what appears there. Yes, there is some irony in using a conversational AI to document the shock conversational AI is causing. But it also makes a point: the dashboard is useful only because every claim points back to a document someone can check. That’s the accountability the exchange itself doesn’t provide. Please cite the original sources, not the dashboard.
This is a living record, not a finished report, and I need help with it. What studies am I missing, especially from outside the United States and Europe? What evidence cuts against the argument? If the numbers stop supporting the claim, I want to know. Did you find a figure that’s wrong, outdated, or misread? Is it readable enough to put in front of a library board, a dean, or a skeptical colleague?
Leave a comment or get in touch. Critical feedback is the most useful kind.