
One of the great joys I have is visiting with very cool librarians. I got that chance in Delaware last week. The State Library is kicking off a stimulus broadband project with the Gates Foundation; public libraries around the state; state agencies in workforce development, adult education and volunteer services; and businesses.
During the kickoff Maureen Whelan, State Director of Adult Education showed the following graph (explanation after the picture) that is simply chilling:
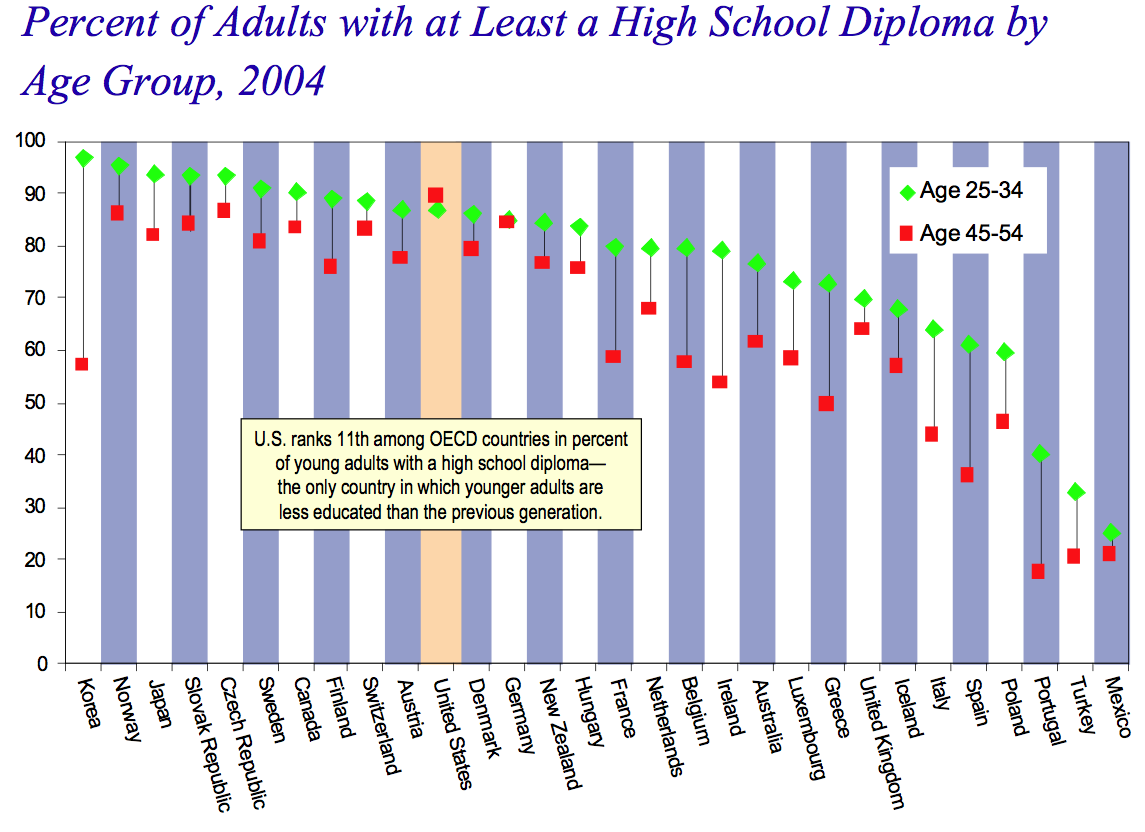
Those red dots are folks 45-54 that have a high school degree. The green dots are folks 25-34 with a high school degree. All of these are arranged by country. Now the chilling part. If you look across the graph note the one big difference with the United States. It is the only country listed where the red dot is above the green dot…the only country where the older generation has more education than the younger generation. The parents are more educated than the children.
Now I realize there are many factors here…as a country we have a lot of folks with high school degrees already for example (hence while Germany is close to even), but there is still a long way to go to 100% of the population has at least a high school diploma.
I’ve been doing a lot of thinking about grand challenges recently – big complex goals that are hard to achieve, but can have major positive impacts on society. How we educate ourselves is clearly one and librarians have a huge role to play.
For more on this graph: http://www.nationalcommissiononadultliteracy.org/content/nchemspresentation.pdf
What part of our population is mentally “challenged” and truly not capable of earning a HS diploma unless we reduce standards or award a pseudo diploma? This goal of 100% graduating just doesn’t make sense in the real world. It also leaves out the subgroup of people who are talented with their hands and minds but can’t achieve in school. When do they get some respect for what they CAN do?
Point well taken, but the question on this graph is : is there a greater number of challenged individuals in the younger age group?
I’m seeing odd photos and message that the .pdf has been photo bombed that you have under “The Librarian Militant, The Librarian Triumphant”. Is that part of the message???
Yes, that was a slide where I talk about attention.
Two points:
1. For the older age group, the US dot is the highest across the board. For the younger group, it’s not in the top 10. It’s not just about comparing us to ourselves. The rest of the OECD is moving forward, and we’re standing pat.
2. The Korea numbers are amazing. A two-thirds increase in basically one generation, showing one facet of the changes that country went through in a couple of decades. Off the main topic of discussion, but interesting nonetheless.